
Cancer Stem Cells
The side population (SP) of tumor cell lines shares characteristics with tumor stem cells. The objective of this study was to phenotypically and genotypically characterize the SP of gastric cancer cell lines. SP cells were obtained from AGS and MKN45 gastric cancer cells using Hoechst 33342 staining and fluorescence- activated cell sorting. The cells were subsequently studied morphologically at cytology and immunocy- tochemistry, on the transcriptional level via gene ar- ray, and in cell culture using recultivation assays. Genes differentially expressed in SP cells were evalu- ated at immunohistochemistry in tissue samples from 486 patients with gastric cancer.
SPs Can Be Separated Reproducibly from Gastric Cancer Cell Lines Using Hoechst 33342 Staining and FACS Analysis
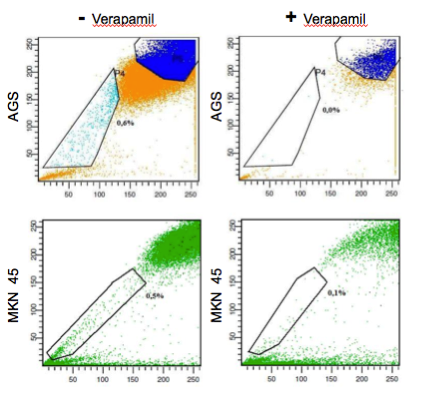
Use of Hoechst 33342 staining and subsequent FACS analysis enabled reproducible isolation of an SP from both gastric cancer cell lines, AGS and MKN45. The SP cells demonstrated lower dye uptake as they effluxed Hoechst 33342 via ABC transporters. Dead cells were identified using the sample gate. Only a few dead or damaged cells were observed, which illustrates the low cytotoxicity of the experimental procedure. The SP cells were identified using verapamil, which blocks the ABC transporters. SP cells were defined as the subset of cells that exhibited a low Hoechst 33342 staining pattern and disappeared with use of verapamil. In pre- ceding experiments. This was consistent with subsequent concentration assays and with previ- ous reports by others.10 Higher final concentrations increased the background fluorescence and prohib- ited the analysis, whereas concentrations less than 5 g/mL decreased sensitivity and impaired identifica- tion of SP cells. The harvested cells were fully suitable for FACS analysis, generating a characteristic image in the Hoechst blue versus Hoechst red diagram (Figure 1), similar to that described by others.14,15 A total of 23 sortings were performed, of which 16 were with AGS cells and 7 with MKN45 cells. The overall per- centage of SP cells within the cell cultures was compa- rable between the two cell lines, and ranged from 0.1% to 0.8%.
SP Cells Self-Renew in Cell Culture and Differentiate into SP Cells and Non-SP Cells
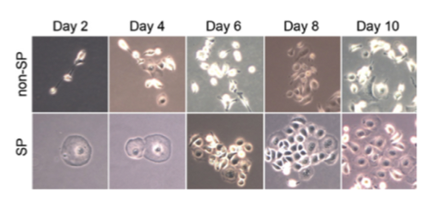
In the next set of experiments, the ability of SP and non-SP cells to reculture in vitro was examined. SP and non-SP cells were separated via FACS and recultured under the same conditions. Recultivation experiments were performed six times with AGS and twice with MKN45. Both cell populations grew in culture again, and were subjected to a second round of Hoechst 33342 staining and FACS analysis after 6 to 10 days of reculti- vation. Recultured SP cells generated both SP and non-SP cells, whereas recultured non-SP cells generated primarily non-SP cells. The fraction of SP cells in the recultured SP population was higher than in the initial population (up to 5.3%). However, the percentage of SP cells in the recultured cells decreased over time; on day 6, the number of SP cells was 5.3%, and on day 10, the number of SP cells had decreased to 0.2% of all cells.
Thus, SP cells were able to reestablish a population consisting
of SP and non-SP cells within 10 days of recultivation.
Non-SP cells did not demonstrate this capability.
Phenotyping of SP and Non-SP Cells
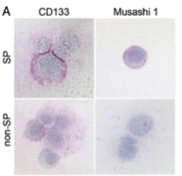
Five different target proteins were selected, which were previously demonstrated to identify stem cells, that is, CD44,5 CD117,16 CD133,17 LGR5,18 and MSI-1.19,20 Cytoplasmic staining was observed for CD44, CD117, CD133, LGR5, and FZD7. A membranous immu- noreaction was observed for CD133 and LGR5. Staining was then evaluated by counting a total of at least 80 cells in two separate high-power fields. For both cell lines, the number of CD133- and MSI-1–immunoreactive cells was higher in the SP fraction compared with the non-SP fraction. CD44 was more prevalent in the SP fraction of AGS cells, and less commonly in the SP fraction of MKN45 cells. CD117 and LGR5 did not differentiate SP from non-SP cells in either cell line
Genes Differentially Expressed in SP Cells Are Also Expressed in Gastric Cancer Tissue
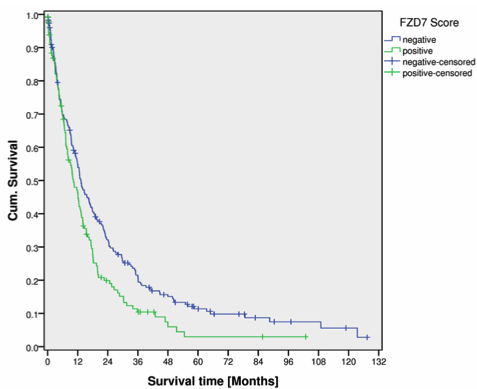
Transcriptional analyses demonstrated that SP cells express genes that encode for stem cell properties including FZD7, HEY1, SMO, and ADAM17. It was observed that ADAM17 and FZD7 are differentially expressed in human gastric cancer, and FZD7-positive cancers are associated with signifi- cantly shorter patient survival. In conclusion, human gastric cancer cell lines enclose a phenotypically and genotypically distinct cell population with tumor stem cell features. Phenotypic characteristics of this distinct cell population are also present in gastric cancer tissue, and correlate with patient survival.